Cy Scott of Headset Inc. on the changing demographics of cannabis purchasing, the slow erosion of flower’s market dominance, and why he’s bearish on the medical market.
“Concentrates, pre-rolls, and vapor pens have high growth as well as large market shares, so they are well positioned to do well in 2018, although those categories are getting more and more crowded,” Cy Scott said from Headset’s headquarters in Seattle. Scott should know. He, along with his engineering buddies Scott Vickers and Brian Wansolich founded Leafly (“the Yelp of cannabis”) in June 2010. The website was a huge success, eventually becoming the world’s largest cannabis site with 40 million page views across its website and mobile apps. “I knew we needed to treat cannabis in a more mainstream light,” Scott said. “I do think us treating the industry in this way really helped Leafly stand out from the pack.”
Privateer Holdings acquired Leafly in 2015. Not one to embrace idle time, Scott, 38, co-founded Headset shortly after the sale. The website was a sort of “follow up to Leafly and focused more on supporting growers, processors, and retailers through data and analytics,” he said. Headset, currently tracking Washington State, Colorado, and California, aims to be the data layer of the industry, helping to illuminate what’s happening on the sales and inventory fronts and taking the assumptions and guesswork out of operating a cannabis business.
Headset was a byproduct of Scott’s years of exposure to the industry, getting to know a lot of operators and learning about how a lack of data limits their decision-making abilities. In January 2017, the company closed $2.5 million from Hypur Ventures, a leading-edge venture capital fund headquartered in Arizona, and Salveo Capital, a Chicago-based private equity fund specializing in cannabis-sector investments.
“Headset specializes in seeing ahead of the curve in terms of trends and innovation in the hyper-competitive cannabis market,” said Hypur Managing Director Christopher Male. “There’s a lot of synergy with the ecosystem of the Hypur Ventures portfolio.”
Headset employs fifteen people spread across three divisions, all of which publish in real-time: Bridge, which provides automated inventory, sell-through, and price point data from client retailer accounts; Retail, which offers easy-to-understand reports about sales, inventory, vendors, products, and budtenders; and Insights, which comprises data-driven decisions based on actionable data.

What methodology does Headset use?
The market data you are seeing, which is one of our core offerings, is based on aggregated data we are able to analyze through connections at the retail level. We map and classify these sales in real-time and are able to report back trends in minutes, not months. Since we began in Washington State, we now directly track well over 50 percent of each dollar spent in that market and are getting close to that type of coverage in other states, including California and Colorado.
What’s the current market for flower?
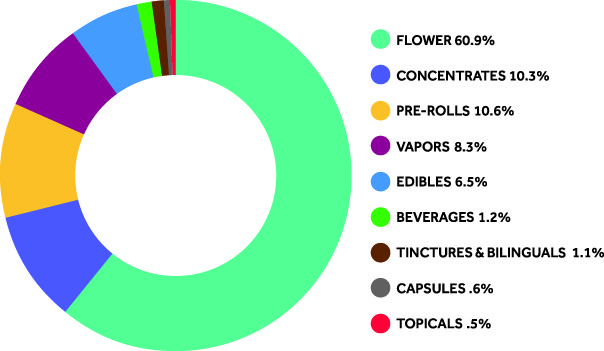
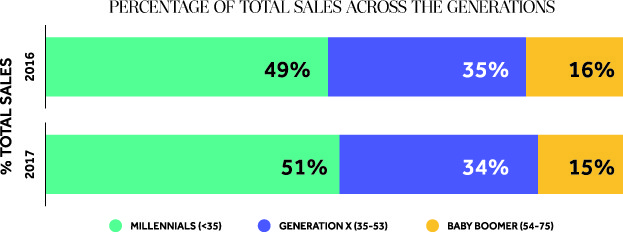
One common thread we’re seeing across markets is the decline of flower’s market share within the industry. This trend is particularly relevant around the younger demographic, who are purchasing a larger share of concentrates and pre-rolls with respect to other generations. While the total percentage of sales of flower is still spectacular, over 50-percent market share in all the regions you mentioned above, it looks like over time it will have a continuing smaller piece of the pie. There are a number of factors that can be driving this, from the explosion in availability of other types of products to new consumption preferences to just overall convenience of other categories like vapor pens.
To what do you attribute the huge rise in concentrates?
I think there a number of factors, starting with changes in consumption patterns like moving away from smoking. The rise in new consumption devices for concentrates is also helping adoption. Convenience, price point, and potency no doubt play a role, as well.
On which states are you bullish?
California is going to be the market for some time, just based on population. It also has the benefit of learning from other adult-use markets that have been active for a number of years, hopefully resulting in a great implementation. I really like the idea of Nevada, particularly for the tourism that will be exposed to the industry. Of course, Massachusetts is interesting as well, and hopefully we will begin to see a wave of legalization as a result on the East Coast. Washington and Colorado have a great ecosystem, mature product lines, and continued growth, too. So, I suppose I’m pretty bullish on all adult-use markets. If I have to be bearish, it might be on certain medical markets, particularly on the East Coast, that are a bit limiting on access and the types of products available.

What are your predictions for California?
California will mirror what we’ve seen in other adult-use markets, which includes price pressure, emerging brands, and non-traditional category growth [i.e. vapor pens]. We will probably see larger brand reach with distribution models coming. Consistency in products, testing, and quality will get better, as it will be required for all operators. A trend towards lower dosages, as the casual consumer starts visiting recreational stores will appear, as well. But whatever happens, it’s going to be very exciting to watch unfold.
What overall pricing trends are you seeing?
Pricing trends can be quite interesting as the market continues to mature. Edibles, capsules, and beverages have just over 50 percent of units sold, inside a range of +/- 10 percent of the average price, while concentrates, flower, and pre-rolls seem to have the least price variance, with only about three quarters of their unit sales within +/- 10 percent of the average price. This could be because extracted oils and flower products are more popular and are less likely to be offered as specials, whereas consumables like edibles, capsules, and beverages might require more price breaks to get customers interested. Price variance trends can tell us a lot about overall market trends, in that the products that see lots of sales at a deep discount might be products that are difficult to move on their own, or are great complimentary products to drive up overall purchase totals.


